Basic Data
Central England temperature data provided through the Future Learn Course "Data Science for Environmental Modelling and Renewables", University of Glasgow lead by Professor Marian Scott. Temperature measurements from central England reveal a gradual rise in temperature from 1659 to 2015 (Figure 1). Temperatures measured in the month of January rise more in the last 100-200 years than do the temperatures observed in the month of July. The parameters for the best fit quadratics are shown in Figure 1.The quadratic appears to do be a good approximation of the general temperature trend over the 357 year observation period. The residuals sum to 0.

b)
Figure 1: a) Daily average temperatures in January; b) daily average temperatures in July.
Best fit lines are quadratics.
Smoothed temperatures in July and January are plotted separately for reference (Figure 2). The winter temperatures have a range of about 3 degrees C, while the summer temperatures range is approximately 1.5 degrees C. Both exhibit a rising trend in recent years, but that rise is more pronounced and persistent in the January temperatures. January temperatures have increased persistently since the early 1800s.

Figure 2: Comparison of smoothed July temperatures (red) and January temperatures (blue).
The three data sets along with best fit quadratics are presented for general comparison (Figure 3)
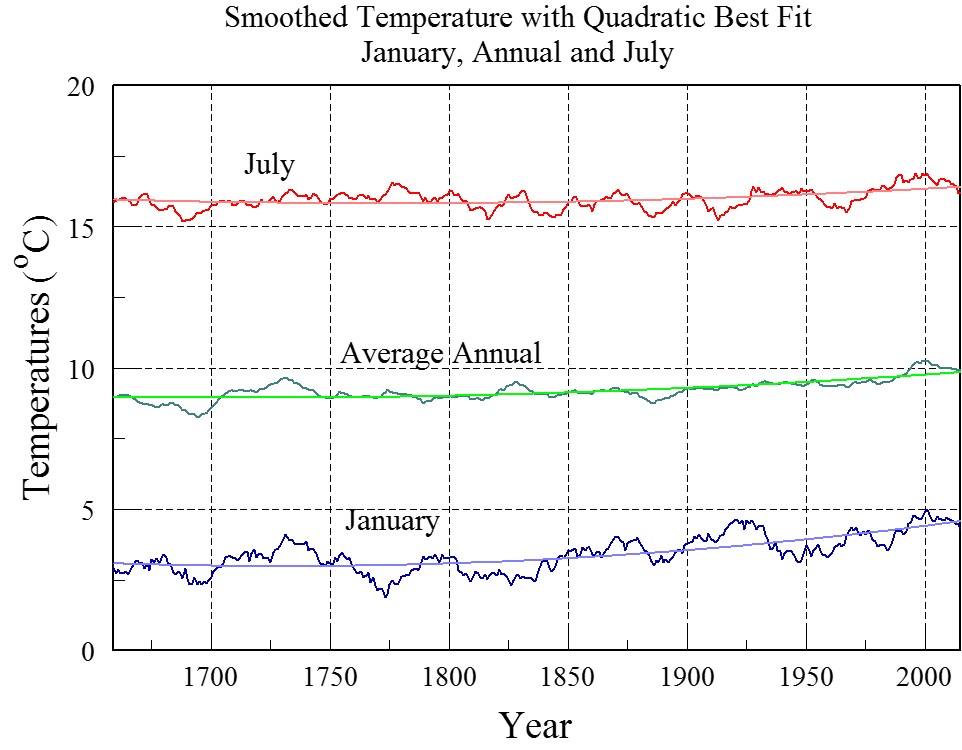
Figure 3: Smoothed July (pink), average annual (green) and January (blue) temperature comparison
The smoothed residual temperatures for July, annual and January (Figure 4) reveal some interesting interrelationships. The comparison reveals multiyear periods of warmer summer temperatures are sometimes accompanied by cooler winters, with the opposite also being true. This dampens the smoothed average annual response during those years. We also see periods of time when both the summers and winters were warmer along with periods when both were cooler.

Figure 4: Residual smoothed temperatures for January (blue),July (pink) and average annual (green)
The amplitude spectrum of the smoothed residuals reveals the presence of prominent longer period features in the temperature series (Figure 5). Temperature variations with periods less than 10 years appear to be largely random.

Figure 5: Amplitude spectrum of January, average annual and July temperatures from 1659-2015.
The expanded view of periods longer than 10 years provides some evidence for cyclical temperature change superimposed on the 356 period of measurement (Figure 6).

Figure 6: Long period peaks in the spectra of smoothed temperatures.
The periods visible in figures 2-4 are most pronounced in the winter temperature variations. Winter temperatures show some cyclicity with approximately 177 and 90-60 year period. These peaks are less pronounced but also present in the summer and annual temperature variations. Summer and winter variations also appear to contain a 40-24 year component. One wonders if the small peak observed between 0.075 and 0.9 cycles per year might be associated with sunspot cycles and accompanying variations of solar intensity.
Comments
- We see evidence of increasing temperature in the July, average annual and January trends. This increase is most pronounced in the January temperatures. Winters see nearly twice the warming with winter temperatures increasing by more than a degree (quadratic fit in Figure 1a) with summer temperatures increasing by approximately a half degree.
- The comparisons reveal periods of time during which hotter summers are accompanied by cooler winters, periods when both summers and winters are hotter or cooler and periods with cooler summers accompanied by warmer winters.
- Cyclical temperature variations are most pronounced in winter temperatures. Temperature variations occur with pronounced periods of approximately 177 years and 90-60 years. Smaller amplitude variations are also observed with 40 to 24 year periods. A speculative observation of potential sunspot cycle periodicity in the temperature data is made.
No comments:
Post a Comment