Spectra of Mauna Loa Wind Speed Data (2011-2014)
Wind speed data spectra shown below were made using data provided through the Future Learn Course Data Science for Environmental Modelling and Renewables. The course is provided through the University of Glasgow with a team of instructors lead by Professor Marian Scott.Daily average wind speeds (Figure 1) were calculated from hourly data in R using the course program intro_windpower. Note maximum windspeeds occur around annually around the new year with average daily speeds of 15-20 mph.
Figure 1: Average daily wind speed Mauna Loa, Hawaii calculated over the 2011-2014.
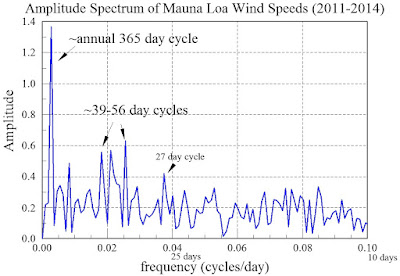
Spectra generated for daily average wind speed data from Mauna Loa reveal the presence of some cyclical wind patterns (Figure 2).More pronounced peaks reveal the presence of annual periodicity in the wind speed patterns along with a series of 39-56 day cycles. There is a band of periodic behavior that stands above the background between 4.5 and 14 day cycles.
Figure 2: Amplitude spectrum of daily mean Mauna Loa wind speed data.
A closeup view of periodic wind speed behavior out to 10 day
periods (Figure 3) shows spectral response down to 10 day cycles. Relative to the peak annual amplitude, these secondary peaks may be more
speculative. 39-56 day cycles do stand out. We also see what may be a 27 day cycle in the wind speeds.
Figure 3: Closeup view of longer period wind speed variations observed on Mauna Loa.
Spectral analysis reveals a prominent annual trend with some additional periodic winds occurring at approximately 40 - 60 day intervals (Figure 3). Reference back to the average wind speed data (Figure 1) suggests these 40-60 day patterns emerge early in the year and are also superimposed on the annual peaks.


No comments:
Post a Comment